| +General Public Services |
63,9 |
14 |
101 |
-7,2% |
| Tbilisi City Hall Executive Entities Expenditures |
48,6 |
10 |
77 |
16,9% |
| State Loan related Operations |
1,7 |
0 |
3 |
24,4% |
| Other unclassified state service activities |
7,1 |
2 |
11 |
-72,7% |
| +Public Order and Security |
18,0 |
4 |
28 |
-4,8% |
| Police departments |
N/A |
N/A |
N/A |
n.a. |
| Fire stations |
18,0 |
4 |
28 |
25,9% |
| +Economic affairs |
112,3 |
24 |
178 |
-5,9% |
| Public transport |
107,0 |
23 |
169 |
-3,2% |
| Other unclassified economic activities |
5,3 |
1 |
8 |
-40,1% |
| +Environment protection |
25,0 |
5 |
40 |
73,3% |
| Waste Removal |
10,0 |
2 |
16 |
n.a. |
| Landscape and Greening |
15,0 |
3 |
24 |
4,0% |
| +Housing and Community amenities |
190,9 |
41 |
302 |
5,3% |
| House construction (improvement and maintenance) |
65,7 |
14 |
104 |
47,3% |
| Utilities Service Development |
70,0 |
15 |
111 |
-1,3% |
| City Lightning |
16,7 |
4 |
26 |
7,3% |
| Utilities Service researches and development |
11,0 |
2 |
17 |
-59,6% |
| Other unclassified housing utilities |
27,5 |
6 |
44 |
19,6% |
| +Healthcare |
23,8 |
5 |
38 |
-9,3% |
| HealthCare activities and service |
0,4 |
N/A |
N/A |
0,3% |
| Other unclassified activities in healthcare |
23,4 |
5 |
37 |
-9,5% |
| +Culture and leisure activities |
22,7 |
5 |
36 |
-31,7% |
| Sport activities |
3,2 |
1 |
5 |
67,2% |
| Cultural activities |
8,3 |
2 |
13 |
-35,2% |
| Other unclassified activities in culture |
11,2 |
2 |
18 |
-39,6% |
| +Education |
48,7 |
10 |
77 |
45,3% |
| Kindergartens |
37,5 |
8 |
59 |
34,0% |
| Additional services in education |
2,9 |
1 |
5 |
32,2% |
| other unclassified activities in education |
8,3 |
2 |
13 |
150,2% |
| +Social Protection |
121,7 |
26 |
193 |
64,1% |
| Social care - Elderly people |
0,0 |
0 |
0 |
150,0% |
| Family and children social care |
61,4 |
13 |
97 |
214,4% |
| Lodging provision |
2,6 |
1 |
4 |
25,0% |
| Other unclassified social care activities |
57,6 |
12 |
91 |
9,8% |
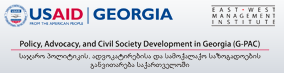
| he expenditures ot the capital Tbilisi are divided into 10 basic areas. Most important part in Tbilisi budget is spending on Housing and Community amenities. |
|
| Total |
626,9 |
133 |
992 |
10,0% |


 WHAT DO YOU PAY
 BUY YOUR OWN STATE
 UNIVERSE OF PUBLIC EXPENDITURES
 STATE WASTE